“Eureka! If I just ran these analyses 23 years earlier!”
This is what I was telling myself few minutes after I was so excited at looking at the nice graphs I generated by analyzing the GC% statistics of about 600 phage genomes (graphs below).
As any good scientist (although they would tell you otherwise), I did the analysis before digging the literature deeply. I just got this urge to perform all kind of calculations on the phage codons and compare them to the phage overall GC%. Of course I know well that the third nucleotide in a codon is under much less pressure than other nucleotides, and thus varies depending on which genome it is located in (depending on many factors including the translational machinery of the host). However, I didn’t know whether anybody bothered to look at the difference between codon GC statistics and genome GC statistics, or the slopes of codon GC% versus genome GC%.
Whether the data below are new or not (they are new of course, since they are done on new sequences, but old since the conclusion was reached in 1987–before some of our lab members were born–, or maybe earlier), the figures look really cool! Another neat study from 1997 is here.

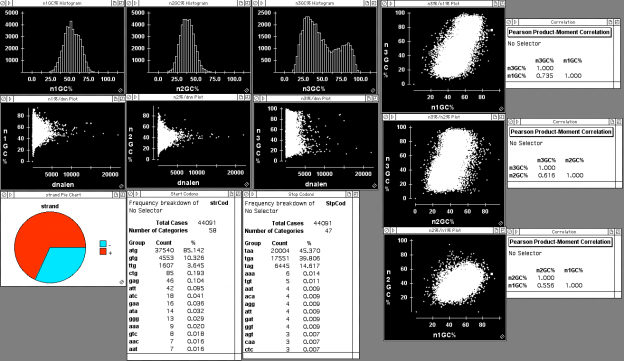
Fig. 1: GC% statistics for individual protein-coding genes (all phage proteins in PhAnToMe)

Fig. 2: GC% statistics for individual phages (all phages in PhAnToMe)

Fig. 3: nucleotide GC% (first and second derivatives) vs genome GC% statistics for individual phages (all phages in PhAnToMe)